Tuesday, December 23, 2008

Tuesday trade - AMAT


This trade was more instinctive than my usual trades. I'm trying to trust my instinct more. AMAT looked very weak relative to the market and it had been testing the 10 level repeatedly over the last week. Looking back it was a 3 pivot point B&B entry. This was a 2.32R trade.

My reasons for exiting were as follows:

  • Choppy conditions, quicker to take profits

  • SMH was nearing PDL

  • Indexes were nearing support levels

  • Very oversold, started seeing green on the tape

  • Setup:70

    Saturday, December 20, 2008

    Failed breakout idea

    I was actually looking at going long at the break of 10.5 yesterday in AMAT when I realized this is one of those setups that isn't quite right and is more likely to fail. The volume contraction is there but the bars aren't very narrow range, and it looks overextended. I'm always looking for a strategy that works well in choppy, rangebound conditions and trading failed breakouts is one contender. This could work well because it doesn't require a complete shift in thinking. I'm always looking for breakouts anyway, so if I find a weak setup, I can take the opposite side of the trade.

    Thursday, December 18, 2008

    Thursday trade - POT

    This was a breakeven trade. USO was looking very weak and I liked how it was testing 33 for the third time. Oil will often make a big move around 2:00-2:30 at the end of open outcry trading. There were also narrow range bars at the ORL in the indexes. Oil and the indexes were both setting up so I was looking for a stock that would move with oil. I chose POT since materials was one of the weakest sectors of the day and MOS and CF had already gone to new lows. I liked the rounded top look. Unfortunately, POT didn't move as much as oil and I was quick to move my stop to break even due to the choppy conditions so I got stopped out on a retrace.

    Setup: 60

    Sunday, December 14, 2008

    Wednesday, December 10, 2008

    More chop - back to sidelines

    This has not been a good month for me. The last two months I broke even so I was beginning to doubt whether I could make money in this high volatility, increasingly unpredictable market. I overtraded the first week of December. The setups I was taking actually were fairly good, but everything I touch isn't working right now. Either I'm off or the market is off, either way I need to stop for a while and preserve my capital. I've learned that one of the paradoxes to trading is that the harder it is, the less rewarding it is.

    Monday, December 8, 2008

    Monday BOR trade - SSO

    My first two trades using my simplified BOR technique have failed so of course I feel like abandoning it. Today seemed like a good day for this type of entry with the European markets up about 7.5%, relatively good news in the morning, and a gap up followed by a shallow retrace. I thought it was impressive that buyers stepped in at the ORL instead of the gap filling more. But buyers vanished and I got stopped out. The one warning sign was that the TICK was mostly negative. There were a couple of volume spikes in the QQQQs, when AAPL was bouncing off 100. Since there was a breakout I had tightened my stop for only a .46R loss.

    Setup:65

    Thursday, December 4, 2008

    Thursday trade - AAPL


    This was a frustrating failed trade. This was a good setup for several reasons. There is a descending triangle formation with a series of lower highs on the 15 minute chart. It also has a cup and handle look. This was the third time the 92.5 level was being tested. You can see the nice breakout bar on the 5 minute chart after a mini bear flag. The tape was looking really good at the time of the breakout. My stop was pretty tight so I got stopped out when the indexes bounced off of the ORL, then everything proceeded to plummet. The most frustrating trades are the ones where you do everything right, you have a lot of confidence in the setup and it still doesn't work out. It's easier to take a loss on a bad setup.

    Setup:65

    Tuesday, December 2, 2008

    Tuesday trade - RIMM

    Today was a tricky day. It was far more bullish than I was expecting. It's like yesterday never happened. My new BOR technique would have worked nicely today but I wasn't expecting such a strong move. Then after the big initial move, I wasn't really expecting much continuation so that left shorting (or a better option probably--not trading). I almost didn't post this trade but I saw that Tyler at "Am I Bald" made the same trade. It really wasn't a bad setup, narrow range bars with volume contraction with the 5 period MA directly above. On the daily chart, RIMM is breaking out of a descending triangle. I also liked the big volume and thought that it could be immune to the overall market. RIMM hardly budged when the market made it's big move in the morning. In the end, I think today was more about the market reacting to all the GM bailout talk than supply and demand.

    Setup:60

    Monday, December 1, 2008

    Monday trade - CF

    I traded this as a pennant. The one thing I didn't like about the setup was the lack of volume contraction, but I liked how weak CF was compared to POT and MOS. At 11:15, USO put in a huge capitulation bar on high volume while CF didn't budge. That really bothered me and I didn't want to sit through a choppy lunch, so I tightened my stop to break even and got stopped out.

    Setup: 60

    Thursday, November 27, 2008

    BOR - new entry technique

    Technique may be too sophisticated of a word for the entry method I'm going to describe. I'm simply going to be buying the break of the open range. This entry will be for days where I'm expecting a large momentum move in the market (i.e. European markets up or down more than 3%, our own markets gap up or down big, the Treasury just announced some new acronym to fix the market...). The price action I've seen play out over the last couple of months has been: 1.) Market gaps up or down 2.) Gap gets partially filled 3.) Price reverses and accelerates strongly to new highs or lows, slicing through the open range high or low. This usually looks likes a rounded bottom or a V bottom.

    I'm calling this technique BOR because it is more boring than my normal style and doesn't require much skill, but sometimes the simplest entries are the most effective.

    BOR Rules:

    1. Place stop limit order two cents above (or below) market opening price at 9:50.

    2. Reduce risk after successful breakout by tightening stop.

    3. Move stop to break even 30 minutes after initiation of position.

    4. Exit position at 11:54.

    November review

    My performance this month was better than last but I know that I'm missing a lot of opportunities. My win rate and expectancy were both improved. The market has traded totally different since mid-September. My entry techniques are still valid, but I'm seeing less setups. Price moves seem to be driven more by news, rumors, or just mob mentality. I'm looking for these subtle imblances between buyers and sellers, but when a move gets under way in this market you just need to jump on and enjoy the ride. While I'm scanning for nice setups the market just takes off and doesn't look back. Then I try to trade sloppy seconds. But it's unrealistic to expect continutation off of a 4 or 5 percent move. In a normal market you tend to have a couple of legs up in the morning. Most of my entries are from 10:15-10:30 expecting continuation of the initial move up. In these extreme conditions we tend to get strong moves that can last all the way until lunch without pause. So long story short, I need to come up with a new entry technique for days when I expect a major move. Now that I've seen a couple months of this new price action, I've come up with a very simple entry technique to add to my bag of tricks. I don't know how long the markets will remain this volatile, but I need to start taking advantage of it. I need to stop looking at the price action as an obstacle and start viewing it as an opportunity.

    Friday, November 21, 2008

    Friday skipped trade - KBH

    With options expiration today and the VIX above 70, I was only going to trade pristine setups. This setup looks even better now than it did realtime, but two things that would have made it even better would be more price contraction on the third bar and if it were fully inside of the second. I was also looking at trading the ABX symmetrical triangle but it broke out too quick and I usually don't trade before 10:15. Looking back over this week I was probably a little too picky in choosing setups. There were many potential setups that were less than perfect that ended up working out.

    Wednesday, November 19, 2008

    Wednesday trade - STP

    I had to choose between this descending triangle or a DRYS bear flag. In retrospect, I wish I went with DRYS, but I liked how STP broke the $10 level and was under yesterday's lows. It broke down pretty nicely, especially when it got below the 9.50 level. Then oil started going up and the market started getting real choppy midday. I thought STP would get to 9 quicker but it had a lot of trouble with the 9.20 area, so I tightened my stop to break even. STP was showing too much relative strength. It finally broke down at the end of the day and after hours.

    Setup:65

    Monday, November 17, 2008

    Monday skipped trade - BIDU


    This was the best trade I spotted all day. I skipped it though because the overall market was drifting around on low volume and was about to go bullish.

    Monday, November 10, 2008

    Introduction to my trading style

    I've been trading full-time since September 2007. I think I'm beginning to find my style. I've borrowed elements from other influential traders like Trader Mike (position sizing) and Trader Jamie (entry techniques). I'm not suggesting that anybody tries to emulate my style, or that my style is better than another style, but it is simply what works best for my personality. I think of myself as a long term short term trader. I never hold anything overnight, but I prefer to be in a stock anywhere from 45 minutes to 6 hours. Early on I ruled out scalping as being too stressful. I had to scalp here and there in October '08 due to the frenetic nature of the market and the VIX hitting 90, but I didn't much care for it. I've read four books on trading just to give me a solid base, the rest I expect to learn from the market. Here are the books though: Trade Your Way to Financial Freedom by Van Tharp, Technical Analysis of Financial Markets by John Murphy, Trading in the Zone by Mark Douglas, and Market Wizards by Schwager. Education is important. At the same time, if you want to learn Spanish, you could take 4 years in high school, or 2 years and then live in Mexico for 6 months to pick up the rest. I think immersion is the best way to learn any subject.

    I'll try to run you through a typical day. I start by looking at the European markets, which are highly correlated with our own. I look at whether they are choppy or trending. I glance at the Asian markets, but they mostly reflect what happened in our markets the day before. I look at the top headlines. If there is a mix of good and bad, and European markets were choppy with little movement, then I will probably form a loosely held expectation that our markets will be choppy that day. If European markets were down big and all our headlines our negative, then I might expect a downward trending day here. It's important not to have too much bias though and to look for early confirmation of your bias. I never trade before 10 EST, so that gives me time to look at the open range to gather evidence for sticking with my expectations. You have to be prepared to throw your bias out the window and be open to what the market is telling you. From 9:30 to 10:00 I look at the stocks on my watchlist to see what is moving the most and getting the most volume. I have about 10 stocks that I like to trade and I'll rotate stocks in and out. I have a Trade-Ideas unusual volume type scan going throughout the day but I don't often trade those stocks. It can be useful to see which stocks are getting investor's attention though. Throughout the day I watch the following using 15 minute candlesticks: QQQQ, USO, XLF, XHB, VIX, AAPL. When I narrow in on a particular sector I will bring up the charts of similar stocks. If I'm trading CF, I'll also be looking at MOS and POT. Looking at each of these charts, I ask myself where is this stock most likely going to go. I admit that I don't know exactly what is going to happen. But looking at chart patterns and support and resistance I take an educated guess about the path of least resistance. Admitting that you can't predict the movement of any stock with 100% certainty frees up your mind. My best trades come when everything lines up. For example, QQQQ and XLF are both setting up inverted cup and handles, USO looks like it's going down and I'm trading the same C&H pattern in AAPL. Every time I put on a trade, I try to have as many factors going in the direction of the trade as possible. I trade breakouts using several different entry techniques. I look at the time and sales when a stock is breaking out and try not to stare at it too much once the trade is looking good. I also use tape reading to help pinpoint my exits. This is an art that I don't think I have come close to mastering, so I won't even try to explain it right now. Just like with my entries, I like to have several reasons to exit a trade. I try to let my trades run until there is just too many reasons not to be in the trade any more. I have an alarm that goes off at 3:40 just in case I haven't exited a position yet.

    I think that pretty much sums up my style at this moment in time. It is constantly evolving so I'll probably have to post an update in six months time.

    Monday trade - DRYS


    This trade was more intuitive than my normal trades. DRYS just looked so weak compared to USO, similar stocks like RIG, and the overall market. There were just no buyers. The setup could be classified as a B&B or narrow range bars with volume contraction at a pivot point. I didn't get the greatest fill on the exit, so this was a 2.2R trade. Reasons for exit:

  • Nasdaq was nearing 1600 with a technical bounce likely

  • RIG and POT were showing signs of strength

  • High volume on hammer at 2:50 in DRYS (sign of strength)

  • Setup:65

    Thursday, November 6, 2008

    Thursday trade - ACI

    Today was a good day to be trading. There were many stocks that made nice linear moves down just like this one. The nearest support level on the S&P was 900, and the index moved down there like being drawn to a magnet. After seeing the European and Asian markets down around 7%, there wasn't any doubt that I wanted to be short. I entered on the break of the ORL. You can see the two narrow range bars with the 5 period SMA directly above the NR7. The only thing that bothered me was that the NR7 had slightly more volume than the previous bar. This was a 2.6R trade. I exited for the following reasons:

  • 3R target was approaching

  • USO looked like it would find support at 50, started going sideways

  • Approaching lunch hour where mass covering often occurs, didn't want to hold through lunch

  • Related stocks like CF and PCX were building bases

  • Setup:70

    Market observation

    I noticed today that the volume was more evenly distributed throughout the day which is an anomaly. Normally, there is greater volume in the morning and afternoon, with an inverted bell shape. I'm guessing that this is a sign of mutual fund redemptions or hedge fund liquidation.

    Wednesday, November 5, 2008

    Wednesday trade - FWLT

    Missed it by that much. I traded this as a bull flag. The setup was a little messy but I liked the volume contraction on the narrowest, 4th bar. It was very slow to break out while oil and all the other commodity stocks were plunging. FWLT was holding up at 30.3, there must have been a large buy order there. I tightened my stop since it was showing too much relative strength. I got stopped out to the penny, before the stock made it's move down. Frustrating, but I don't think I would have played it differently. I might still be in scalp mode after last month.

    Setup:60

    Tuesday, November 4, 2008

    Tuesday missed trade - GDX


    This was a really nice setup for several reasons. The US dollar was down big today, ABX and GDX had a nice daily chart, ABX showing nice volume contraction in a bull flag, and GDX had nice volume contraction before the breakout. My only reservation was that the 5 period moving average was too far away on the 15 minute chart. If I had been looking at the 5 minute chart I would have been quicker to take the trade.

    The market appears to be stabilizing at least in the short term. The VIX is coming down and I feel like I can let trades go for more than 15 minutes now. I became reluctant to trade after last month, so I need to become a little quicker to trade now.

    Thursday, October 30, 2008

    One explanation for recent volatility

    If you ask me, trading hasn't been the same since the short sell ban on financials. Stocks used to move smoother when arbitrage strategies were being used by the hedge funds. The five minute charts have become increasingly choppy, so I've started relying more on the 15 minute. The following quote describes exactly what I think is going on:

    "Analysts said the low volumes could be attributed to the absence of many traders, particularly statistical arbitrage players who would ordinarily be responsible for significant volume on a daily basis.

    Dan Mathisson, head of Advanced Execution Services, Credit Suisse’s algorithmic trading platform, says that when the short selling ban came into force in the US in mid-September, hedge funds “turned off their long/short algos, volatility began to spike and bid/ask spreads widened”.

    “If you take algos out, you enhance volatility. A lot of people don’t understand that yet. It’s tied to the hedge funds reducing their trading and exiting the market, leaving the market much more exposed to volatility,” he says."


    Source: Financial Times

    More chaos

    Sometimes patterns emerge from chaos and sometimes chaos is just simply chaos.

    Wednesday, October 29, 2008

    Oil - direct relationship with market continues

    The link between oil and our markets appears to be strengthening. I would guess that the short term rally in the dollar was starting to hurt us in the U.S. Exports were the one bright spot in our economy. I haven't been trading as much lately. There are definitely opportunities out there, but I think this market calls for more instinctive trading. I'm still looking for picture perfect setups and there haven't been as many of those lately. We get these sharp moves that seem to come out of nowhere. I'm at break even this month. To those who are doing well this month, congratulations! If you can trade this market, I think you can trade any market.

    Friday, October 24, 2008

    Be careful out there!

    Look for the VIX to hit 100 today. If you're an amateur like myself you should be sitting on the sidelines today preserving capital or at least decrease your position size. On days like this, orders don't always trigger like they are supposed to so you're risk increases. I know agressive traders love this high volatility, but it stresses me out too much. I'm looking forward to a day when the VIX gets back under 30.

    Monday, October 20, 2008

    Monday trade - STP

    I traded STP as a bearish pennant. You can see the nice volume contraction and the three inverted hammers in a row. Oil was starting to move down after gapping up, XLF was setting up an inverted cup and handle, and the Nasdaq started making new lows. I thought seriously about exiting at 21, but I ended up getting out at 21.18 for a 1.38R trade. Once USO hit support at 59, the whole market turned back around along with oil. I've pointed out before how the market is moving directly with oil now instead of inversely and this continues to be the case.

    Setup: 80

    Tuesday, October 14, 2008

    Tuesday trade - POT

    This was my fastest profitable trade so far. 2.79R in 10 minutes is not bad. I traded this as a bear flag shorting at 104 and covering at 101.21 (initial stop at 105). The setup wasn't extremely clean but there was volume contraction and I liked how it was close to the 100 psychological support level. I think of major support and resistance levels as exhibiting gravity--they will often suck price down to its level. POT took a stab at hitting 100, but then the tape slowed, so I exited. In better conditions I might have been more patient, but with the choppiness I was quick to take profits. With the huge volume POT was seeeing today, the orders executed in about .2 seconds.

    Setup:75

    Thursday, October 9, 2008

    Unprecedented Fall


    I've never seen anything like this. I thought we could see 9000 or 8000 in the Dow, but I thought it would take several months to get there, not two weeks. We sliced through 9000 today like it was butter. I was actually thinking about moving a small amount of money into the market in my 401K this morning but then I remembered the saying about falling knifes. We've never witnessed a massive deleveraging like this, so there is no case study. Being invested in the market long term also affects my market neutrality. It still seems like we should get one last massive bear market rally but I won't bet any money on that. I'm starting to wonder what trading is going to look like one or two years in the future. I'm guessing low volume, low volatility sideways action for several years as the number of players decreases. Bush is going to give a speech tomorrow to "Assure the Nation". It's like a CEO denying their company is bankrupt. The markets will probably sell off when he starts speaking. Sorry to be so negative...

    Thursday trade - LEN

    This was actually a pretty decent setup that just didn't work out. This was a base and break, and you can see the volume contraction before the breakout, the breakout occured on increasing volume and then proceeded to do a 180. This setup would have been stronger if the peak before the breakout was even lower then the previous peak. Also, the time of day was not ideal and the day was very choppy until the late day breakdown.

    Setup: 70

    Wednesday, October 8, 2008

    Interesting day


    Today was very interesting. A global interest rate cut is a lot to digest so chopiness was to be expected. But there were signs of buying at least for short periods of time. I don't know what happened at 1 p.m., if it was just traders returning from lunch, everybody spotted the falling wedge, or if somebody started a rumor, but that was a pretty strong move. In Google Finance, when I see all the indexes overlapping, that indicates to me that a move has conviction. At the end of the day though, the Nasdaq bounced off of 1800 and we're left with what looks like a double top.

    Tuesday, October 7, 2008

    Tuesday trade - DRYS

    I traded this as a bear flag / short term double top. Whenever I find myself trading the same stock several times in a row, I make sure that I'm not treating the stock as a good luck charm. This was a half decent setup but the one thing I didn't like about it was the volume spike early on indicating that most of the people who wanted to sell probably did so on that bar. But I liked the short term double top look, and I still thought there was a good chance it would retest the ORL. Once DRYS couldn't break 23, not even by a penny, I started thinking about exiting. When USO moved down from 73 to 72 like I was expecting, and other oil sensitive stocks moved in sympathy, and DRYS held firm, I exited.

    I've started a new way of thinking for exiting. Before I enter a trade I try to visualize how I expect the stock to move. Once the stock doesn't conform to my visualization, I consider exiting.

    Setup:65

    Wednesday, October 1, 2008

    Market indigestion

    I'm on the sidelines until things quiet down a little. Some major rumor or news is coming out every hour. This afternoon, the market has to digest the CNBC rumor that the ban on short selling may be extended, Ford had a terrible September, and GE is issuing more shares or something. Technical analysis is next to useless in this news driven environment and you can't tell if a pattern is being formed by supply and demand or driven by news.

    Tuesday, September 30, 2008

    Tuesday - dollar makes big move up

    Why do I get the feeling Paulson is trading Forex today? We've already seen the government is more than willing to interfere with our markets.

    Looks like a weak kickback rally today (the percentage moves seems impressive at first glance though). Very little volume. Last day of the month sector rotation perhaps. When the bargain hunters appear after each big move down, it makes me feel like we still haven't hit bottom. When people are thoroughly disgusted with stocks, that will be the time to buy for the long term. The VIX seems elevated lately, probably because of the short selling rule. I think options activity has increased to get around the shorting ban. We don't normally hang out above 30 for several days in a row.

    Friday, September 26, 2008

    Friday trade - RIMM


    I really liked this trade. It ended up being break even, but the setup was good, and if I saw the same setup again I would make the same trade. There were several things that I liked about this trade:

  • Series of lower highs showing bearish sentiment

  • NR7 at base of ORL on 15 minute charts with volume contraction

  • Descending triangle look

  • Base & Break setup on 5 minute charts

  • With the strength of the setup this one should have broken out quicker, so I was quick to move my stop to break even when it didn't break as fast as expected. I started seeing some bullish setups in other Nasdaq stocks too. AAPL was putting in a rounded bottom. My one reservation with the setup was the time of day, right before lunchtime which is most often choppy. However on Fridays, I have a theory that traders try to take a half day and stick around until 1 EST. Perhaps this Friday was different with everybody waiting for news on the Congress bailout plan.

    Setup:80

    Wednesday, September 24, 2008

    A Perfect Day...


    ...not to trade.

    On days like these, setups look like they're going to breakout and they never do or they headfake. We either have indecision or temporary price equilibrium. It looks like we'll print a doji by the close today.

    Tuesday, September 23, 2008

    Tuesday trade - DRYS

    This was an ok trade considering today's chop. I felt like commodities and oil were going to take a breather today (backed up by their charts of course). The breakout of the inverted C&H was fast and furious, but then it slowed. Once I saw the ascending triangle shaping up, I set a stop at 47.2 in case DRYS broke out of that pattern. It did break and dealt me some slippage. In retrospect I should have just exited the trade when I spotted the pattern but I was encouraged by how linearly POT and USO were moving down. I'm starting to rate my trades from a scale of 1 to 100. I've seen traders use a lettering scheme (i.e. A-, B+), but I think in numbers and this will let me calculate an average setup figure each month to indicate how selective I have been.

    Setup: 75

    Friday, September 19, 2008

    Historic week

    That was the most insane I have ever seen the market. I made a couple of mediocre trades this week but I was not in a relaxed state of mind. My trading platform couldn't keep up with the volume, so my quotes kept dropping out and my orders took about 10 seconds to enter. Stocks were moving so fast, I think the possibility of getting major slippage or of a trade not triggering becomes a very real possibility. We set a volume record this week. I can imagine network switches in New York too hot to touch during these times. We're told as traders to control our fear, but there is a time for healthy respect as well. Know your limits and know when to sit on the sidelines. When the VIX gets over 30, the rumors start swirling. The probability of a game changing piece of information coming out increases (i.e. Thursday's CNBC rumors). I also found myself too focused on the fundamentals with a new bailout every day. I couldn't resist reading about every new development.

    Anyway, I'm going to try to block out all the financial news this weekend and come back fresher on Monday. I'm not happy with the government's intervention in our "free" markets just like everybody else, but focusing on that won't make me trade better.

    Wednesday, September 17, 2008

    Enormous volume

    My quotes can't keep up with this volume. These conditions are really good, but it's too frustrating/stressful when my quotes drop out every 30 seconds.

    Saturday, September 13, 2008

    Finding and maintaining the proper mindset for trading

    Anybody who has been trading for a while comes to the realization that trading has a lot to do with psychology. When I first started I thought trading was 50% analytical and 50% psychological. Now I think it is about 70% psychological. If you listen or read interviews with successful traders, they never say my trading was awful until I discovered that I should only trade when the RSI is above 20 or some other technical indicator. Breakthrough comes when a trader makes a mental breakthrough or discovers something about themselves psychologically that was hindering their trading. You know somebody has been trading for a while when they start to sound like Phil Jackson!

    My win ratio first started to climb when I became more disciplined. It sounds easy--only trade the best setups. In practice though, sitting and watching charts for 6 and a half hours without making a single trade is difficult at first. Discipline takes energy. I find that my most impulsive trades come on Friday after I have been careful the whole week, and my discipline starts to wane. For a while I was getting in the habit of trading. I was making a trade or two per day. I always told myself, maybe I won't trade today, but it's hard to trick yourself into thinking that after you've traded 5 days in a row. If you find yourself in a trading habit, it is helpful to restore discipline by just watching the market for a day. You need to be able to watch good setups come and go for a day without any regret that you just missed out. Notice how much more clearly you see things when you aren't trading. It is easy to fall into a trading mindset, frantically searching for the next trade that is going to make you money. I try to stay in "impartial observer" mode until the last second when I need to actually pull the trigger and enter the order. What it really comes down to is clearing your mind of desire.
    • From craving (attachment) springs grief,
    • from craving springs fear;
    • For him who is wholly free from craving, there is no grief, much less fear. (Dhammapada Sutra. In Narada Maha Thera, The Buddha and His Teachings.)
    I'm not a Buddhist or anything but I find this philosophy very interesting. I'm sure you have heard that you need to control fear and greed when you are trading. Well this shows that fear can come from craving. So it follows that if you can keep your desire to make money in check, then you can restrain fear. I remember in Market Wizards, one of the traders said as soon as he started to trade with a certain material object in mind that he wanted to buy, his performance plummeted. So his craving probably resulted in fear which interfered with his objectivity. Have you ever made a trade that didn't work out and then when reviewing the setup, it looked totally different than what it looked like at the time you initiated the trade? I know I have. This is a sign of lost objectivity.

    Once you find the proper mindset, you must maintain it. It is normal for human emotions to fluctuate of course. You need to find a way to get yourself relaxed and into impartial observer mode. For me this was aided by listening to relaxing music, it could be different for you. Once you find the proper mindset, I think you will discover that your trading improves greatly.

    Tuesday, September 9, 2008

    Tuesday trade - DRYS


    I've mentioned before that I like to have several reasons to exit a trade. I also like to have several reasons to enter a trade. When I see a setup taking form, I try to gather evidence that the overall market is going to trend in the direction of the trade. Tuesday was nice because there was no question I wanted to be short after the second day in a row of the S&P bouncing off of the 50 day MA and the tepid reaction in the US to the Frannie bailout. In the middle of the day, XLF was setting up an inverted cup and handle and the QQQQs looked to be forming a short term double top. I also look at similar stocks in the same sector. I liked how DRYS didn't bounce off it's morning low as much as stocks in related sectors like POT, showing relative weakness. You can also see how little volume there is in the bear flag, and that the volume is declining. I try to put the odds in my favor as much as possible. This also gives you more confidence to stay with the trade. I exited this trade as the Nasdaq was hitting the previous day's low, DRYS was nearing 50 (strong support), the dojis were showing high volume (sign of covering?), and I was starting to see green on the tape. It's not every day I nail the exit, so I was happy with this 4R trade.

    Monday, September 8, 2008

    Oil - relationship breaking down?

    This graph shows how oil has moved more in step with the market over the last few days. Notice how today, oil formed a bit of a double bottom right before the Nazdaq did the same. Normally, oil has an inverse relationship with the market. I can explain this in a few different ways. One explanation could be that the employment report last week and the Fannie and Freddie bailout (not a backstop any more) far outweighs the daily fluctuations of oil. Another explanation is that the sentiment about oil prices could be changing. Normally, lower oil means the consumer will have more discretionary income which is a postive for an economy based largely on consumer spending. But the biggest fear lately is that we are going to experience a worldwide recession, not just a U.S. slowdown. So lower oil might now remind traders of slowing global demand, which will have more impact in the long term. The third explanation is that all of this is just a coincidence. I'll be watching this over the next week to see if this new relationship continues.

    Wednesday, September 3, 2008

    Wednesday trade - DRYS


    After 3 months of watching breakouts fizzle, I became very quick to take profits. Wednesday morning was very choppy so I was in quick profit taking mode. I saw that DRYS was slowing at 65.5, and my 3R target was 65.4. The one thing I failed to recognize was the Head & Shoulders pattern in the indexes. So instead of 7R I got 2.2R. Now that the volume has returned to the market I will have to be slower to take profits, and expect stocks to run a little further. I still haven't come up with a formal exit strategy, but I have several ideas in mind.

    Saturday, August 30, 2008

    August review

    The first half of August was decent, but the second half was like molasseses. It was one of those periods where I kept thinking my quotes were frozen up since nothing was moving. It's also the first time I actually felt bored because I knew it wasn't a good trading environment and that I was better off not trading. But it was still my most profitable month yet. I set new records for expectancy and win ratio as well. I credit this to recognizing the change in conditions and the drop off in volume and being more hesitant to trade. In the past I would just charge ahead or get frustrated. But if the market is giving you lemons, don't try to make lemonade. Just sit back and wait for the market to start giving you -insert favorite fruit here-. Another good motto is "when the going gets tough, stop trading". The bulk of my profits in August came from the first two weeks, and instead of giving back those profits in the last two weeks, I made very few trades and preserved my capital. I switched in to observer mode and started thinking about how I could adapt to the changing conditions. Half of the stocks on my normal watchlist weren't trading with enough volume to avoid major slippage, so that reduced the number of opportunities. I noticed that Trader Jamie started trading more gappers, so this will be my focus in the future when we hit a low volume period. Gappers normally have an unusual amount of volume and ignore market direction for the most part.

    I'm looking forward to September when traders come back from their vacations.

    Friday trade - AAPL

    I liked my entry on this inverted cup and handle. Obviously, the exit could have been better. My 3R target was 169, but the whole morning was trending and very pessimistic after the personal income data and Dell gapping down, so I just tightened my stop to 170.2. I didn't notice the second cup and handle at 170 in real time, which would have made me quicker to exit at 169 due to the shallowness of the cup. But I got 1.81R out of this, and ended the month on a good note. I've noticed that Friday's trade much differently then any other day. It appears that many traders like to take a half day. Usually traders go out to lunch around 12, so they start covering at 11:54ish. On Friday's, there isn't mass closing of positions until 12:30-1.

    Thursday, August 21, 2008

    Wednesday trade - RIO


    Wednesday was utterly choppy, and today is looking even choppier. I've adapted by focusing more on sectors and being quicker to take profits and/or tighten my stops. Oil made a big move down in the morning after the inventory report at 10:35. Then it started basing and turning around. When oil is going up, I decide whether to short a transportation stock or bank, or to go long in an energy stock. I found a nice base and break setup in RIO. I liked how it carved out a shallow cup before the breakout point of 26.62 and I thought that oil was likely to continue rising until it neared the morning's ORL. RIO broke out so fast I exited with a 1.93R profit after being in the trade for only 14 minutes. This isn't my normal style (really more of a scalp) but I don't trust this market, so I'll take what I can get.

    When I'm trading at my best, I weigh several factors before entering and exiting a trade. My reasons for exiting this trade were as follows:

    1. Oil nearing ORL, likely to slow (RIO was moving in sympathy with oil).
    2. Time approaching 2:30, when open outcry crude oil trading ceases (less volatility).
    3. RIO approaching upper trendline and psychological resistance at 27.
    4. Choppy, low volume conditions.
    5. Order flow was slowing, only one or two prints at 26.91.

    Thursday, August 14, 2008

    Achieving Consistency

    Every trader should strive to be consistent. But what does consistent really mean, earning X amount of dollars every month? I think it is unrealistic to think you can make a certain amount of money each month, and dangerous to set this kind of goal. The market can be inconsistent and fluctuates between trending and choppy. There are some months that will offer more opportunity for your particular style of trading. I think a better goal is to aim for a certain win ratio, or expectancy. This is where discipline comes in, because you shouldn't be trading when the market conditions are not ideal for your trading style. So on those months where there is less opportunity, you can still have x percentage of winning trades, but on less trades, by being more selective.

    It's simple really, but the two keys to consistent trading in my opinion are:

    1. Only trading the best setups.

    2. Only trading when the market conditions are favorable.

    Wednesday trade - WB

    I traded WB as a double top. I was pretty confident that it was going to break down at least to the 15 level. That level proved strong though and it took some time to break through. After it broke through I wasn't convinced it was a clean break so I tightened my stop to 15.06 for a .91R win. If 15 was broken it should have served as resistance, preventing WB from hitting my stop. The market action has been underwhelming Wednesday and Friday (low volume) so I've been quicker to tighten my stops to protect profits.

    Monday, August 11, 2008

    Monday trade - MOS

    This was a nice 3.4R trade. Notice the heavy volume contraction and NRIBs after the big move down in the morning. Oil was coming down, even with all the Russian news and commodities tend to move with oil and inversely to the dollar. You can't kick yourself for not being omniscient. In retrospect, you always could have done something different to make a trade even better and it often feels like you're leaving money on the table. I exited because it looked like oils decline was slowing and possibly putting in a bottom. I was right but it took over an hour for oil to consolidate and eventually reverse.

    Tuesday, August 5, 2008

    Monday trade - DRYS


    This is an example of a good entry (inverted C&H) but a hasty exit. The market has been choppy this summer and this day was no different. So I took my 2.56 R profits at the round number 69. Energy stocks ended up being very linear this day, far exceeding my expectations given the overall market conditions.

    Tuesday, May 27, 2008

    Tuesday trade - CF


    This was a nice 3R trade off of a bear flag. I covered at 122 as the S&P was hitting 50 DMA support at 1373, and my target was reached.

    Wednesday, May 21, 2008

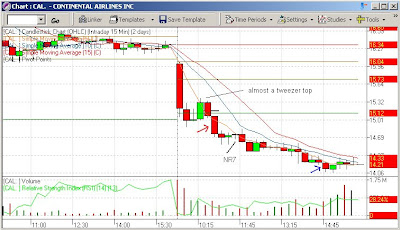
    Wednesday trade - CAL


    Today was a good day to be trading. This trade really tested my patience though. Most of my trades last less than an hour or two. But oil kept going up and the market kept going down so there was no reason to exit. Some of the other airlines were going down faster but I liked the descending triangle setup on the daily charts for CAL. I entered at the break of the ORL and exited when I saw a couple of volume spikes on the 5 minute charts as CAL approached 14. I nearly got filled at the low of the day so I'm happy with my exit. I had a pretty strong feeling that the 1410 level was going to break down after almost slipping through around 11 a.m and after testing this level twice yesterday. The negative FOMC minutes helped pushed the S&P past 1410 and out of a rising wedge formation.

    Tuesday, May 6, 2008

    Identifying trending days


    Today was a pretty nice uptrending day after the initial move down. To take advantage of these days you want to recognize them as soon as possible. One tool I use is the TICK. Trending days are one sided where there are mostly buyers or mostly sellers. You can see that the TICK today was mostly positive throughout the day. When it did go negative around 2:00EST, it only hit -280, while on the positive side the TICK peaked at 1753.

    Monday, May 5, 2008

    Monday trade - WM


    Today was really choppy so I was on edge. I had a good entry in WM but then all the other banking stocks made a big move up. In retrospect staying in this trade would have been good, but exiting seemed right at the time. I've noticed that on low volume, choppy days, there is slightly less herding among stocks within a sector. On these types of days I will place less importance on what stocks in the same sector are doing going forward.

    Saturday, April 26, 2008

    Friday trade - UAUA


    This was my most profitable single trade so far. I'm not bragging, but not all trades work out this well so you have to celebrate the ones that do go according to plan. I got in at 14.95 on the break of the NR7 bar. All the other airlines were going down at this time so it looked like the only thing holding UAUA up was the psychological support at the even number 15. The pivot point was above my entry, all the moving averages were downsloping and evenly spaced, the overall market was going down at the time, oil was setting new highs, the 5 period SMA was pushing this stock down, basically everything lined up. My past exits have been too quick so I was consciously letting this one go a bit longer than usual. I covered at 14.278 when the S&P was hitting 1380 after a big spike down, the other airline stocks were printing hammers, and there was a volume spike on the 5 minute charts a little earlier in UAUA. So this was a nice 4R trade.

    Another thing I liked about this trade was my psychology. I was very calm throughout this trade. Sometimes I get a surge of adrenaline when I cover, but I didn't even experience that this time. I think the more confident you are in a trade, the less fear and anxiety you experience. You get adrenaline rushes when you're in danger. So if you get a surge of adrenaline before a trade, maybe that is your subconscious telling you you're about to do something risky.

    Friday, April 18, 2008

    Friday trade - RIMM


    I had a good trade with RIMM today. It could have been great, but like I said, I'm working on my exits. The trade started with a good entry at the break of the cup and handle. At the time I exited, the Nasdaq was slowing around the 2400 point. RIMM retraced pretty good around 11:15. You can see the inverted umbrella at my exit point. If I was only looking at 15 minute charts, I probably would have stayed with this trade (ignorance is bliss, right :)). Another factor was that we were nearing the lunch hour which is normally choppy and directionless. Another 25 minutes in this trade would have made a big difference.

    Saturday, April 12, 2008

    Week in Review

    This was my best week so far in trading. I managed to eke out a profit and the majority of my trades at least went my way long enough to move my stops to break even. My entries are getting much better and I'm getting a lot more "looks". My entry technique is more solidified and I'm working on my exits. I had a lot of opportunities to take 1.5R in partial profits this week. I may add this as an exit rule in choppy conditions. As far as the market goes, I think we had three good trading days this week, Monday, Thursday and Friday. The rest were pretty choppy. We never closed above the upper trendline in my previous post and now with the GE earnings as a forecast of what's to come (less solid companies will be reporting earnings soon), a cross below the 50 day moving average, it looks fairly downhill from here. My one reservation is that the VIX never exceeded 24 on Friday. Two reservations, the volume wasn't very high either. It as if the buyers just stepped aside to save their money for another day. So I'm short term cautiously bearish.

    Thursday, April 10, 2008

    CF - cup and handle


    This is another trade I was looking at, actually would have worked out better than my INTC trade. Hint: When you see patterns start to form in the market overall, go through your watchlist and see if you see the same patterns in your basket stocks.